Subversion Statistics forRietveld (/trunk/)
(20 Jan 2011)
As tribute to python and author of Python-Guido van Rossum, I have generated the graphs below for Rietveld project.
These results are generated with SVNPlot (version 0.7.3)
| General Statistics | |||||||||||||||||||||||||
|
|||||||||||||||||||||||||
| Top 10 Hot List | |||||||||||||||||||||||||
|
|||||||||||||||||||||||||
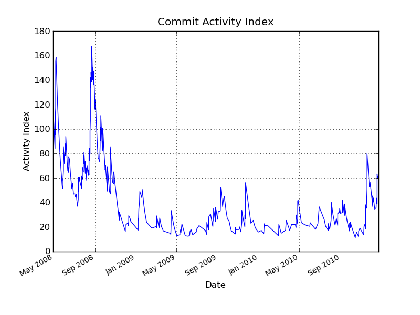
Commit Activity Index |
|||||||||||||||||||||||||
File Count and Lines of Code stats |
|||||||||||||||||||||||||
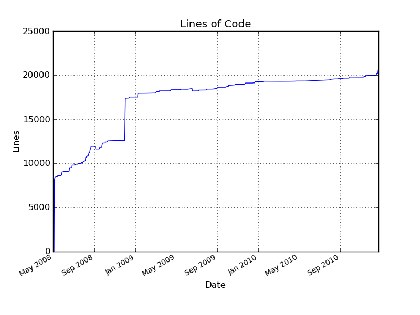
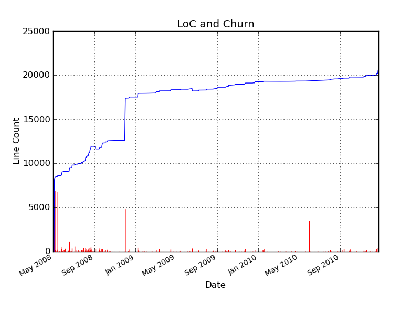
| Lines of Code At start of december jquery.js is added and that gave big jump in the LoC count. |
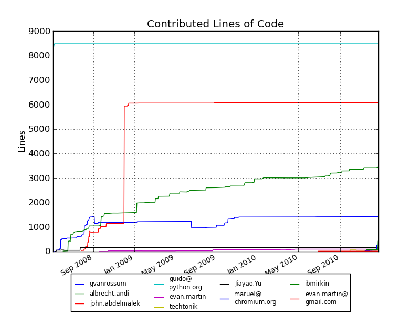
Lines of Code (Contributed by different Authors) Contributed lines of code is good way to get a 'feel' of different authors contributions overtime. But remember that LoC is not a good way of measuring a contribution. So if you want to use SVNPlot , donot use this as input for appraisals :-) |
||||||||||||||||||||||||
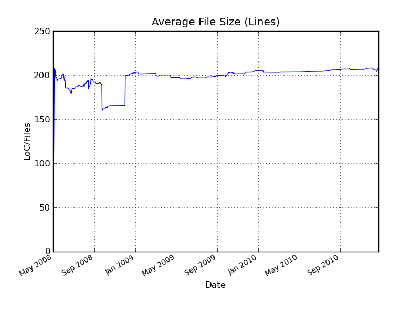
Average File Size (in Lines)
Average file size is relatively small and it is now stabilized. To me it indicates the quality and care of the developers. |
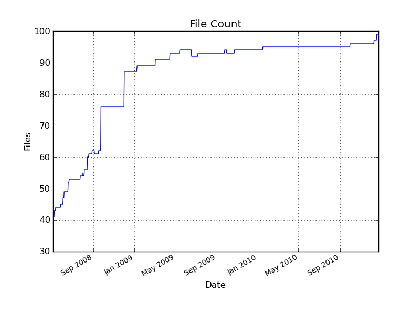
File Count
File count is stabilizing. Addition of new files is not so frequent. Its an indication that major part of feature development is done and now the project is slowly going in maintainance phase. |
||||||||||||||||||||||||
| LoC and Churn churn - number of lines modified (added lines +deleted lines). A very high churn as before release may indicate potential problems in release |
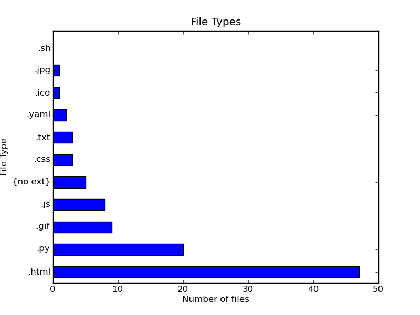
File Types |
||||||||||||||||||||||||
Commit Activity Graphs |
|||||||||||||||||||||||||
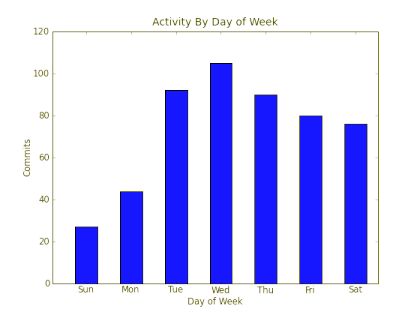
Commit Activity by Day of Week
It seems for some reason Tuesday is favourite day for commiting. I am not sure why. My guess will be developers get new ideas over weekend (Sat/Sun) and they implement and commit by Tuesday |
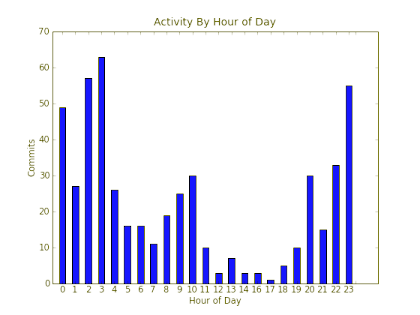
Commit Activity by Time of Day
5-6pm seems be typical time of commit. The commit times are in GMT. And I am not sure abou the geographical location of the team members. So no conclusion here. However, if this is a project in a software company with all developers in same timezone and there are regular commits at 10pm, I will conclude that developers are overworking and probably the project is trouble. |
||||||||||||||||||||||||
| Author Commit Activity (by Hour of Day) |
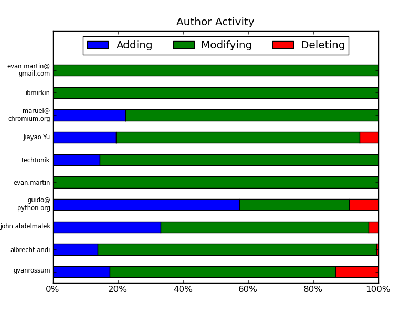
Author Activity
Authors activity in terms of 'addition', 'modifications' and 'deletions' of files. Its an indirect indication of author's role as 'contributor' of new features/code and maintainer of existing code. |
||||||||||||||||||||||||
Directory Size Graphs |
|||||||||||||||||||||||||
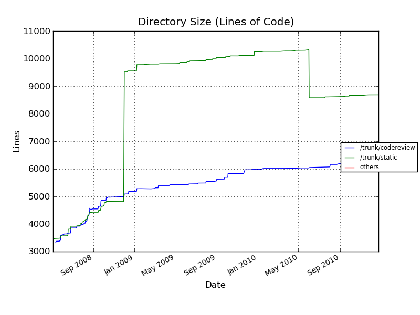
Directory Sizes
There is a significant increase in Dec 2008 (probably because of addition of jquery related files) |
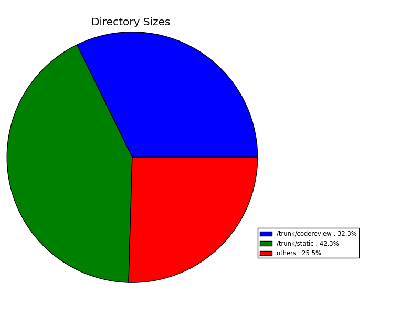
Current Directory Sizes
|
||||||||||||||||||||||||
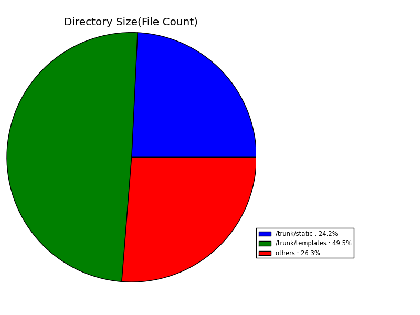
| Directory Size (Number of Files) |
|||||||||||||||||||||||||
Tag Cloud of Words in Commit Log Messages |
|||||||||||||||||||||||||
account
add
appspot
avoid
base
change
chromium
code
codereview
com
comment
default
diff
django
email
error
file
fix
git
http
line
link
list
make
more
need
nickname
page
patch
patchset
py
remove
review
rietveld
see
set
show
side
support
svn
tag
template
up
update
upload
url
use
user
using
work
|
Author Cloud | ||||||||||||||||||||||||
|---|---|---|---|---|---|---|---|---|---|---|---|---|---|---|---|---|---|---|---|---|---|---|---|---|---|
| The size of Author name represents number of commits by author. Color of author name represents the 'activity temperature'. Recent activity gives 'redder' color. If there are no recent activity color slow goes to 'blue'. This representation gives an idea about who are recent contributors and who contributed big chunks
Jiayao.Yu
albrecht.andi
evan.martin
evan.martin@gmail.com
guido@python.org
gvanrossum
ibmirkin
john.abdelmalek
john.abdelmalek@gmail.com
maruel@chromium.org
nick.johnson@google.com
techtonik
vincent.zanotti@google.com
|
|||||||||||||||||||||||||
