Recently I have been studying if we can apply the social network analysis (SNA) to Subversion repositories. I also wrote a
blog post on it. I am using the sqlite3 database created with SVNPlot to study the SNA.
The idea is to create social network graphs by
- treating Authors and Files as 'graph nodes'
- A link (or edge) is created between the author and the file he created.
- A link (or edge) is created between two files when the files are edited as part of single revision
- Graphs thus generated are analysed for degree centrality, closeness centrality, how the centrality is changing over time, clusters of files which are generally edited together.
This time also I am using
Rietveld project as an example. And I am using
NetworkX (for network analysis),
Matplotlib (for generating graphs/outputing network diagrams),
GraphViz (for graph layouts),
PyDot(for interfacing between the NetworkX and GraphViz).
It is amazing how quickly you can prototype something by using the excellent opensource software like NetworkX, Matplotlib etc and a language like Python.
Given below the different graphs generated/analysis and my interpretation. Please note that I am not an exert on Social Network analysis (SNA). So if you find a mistake, please add it in comment and I will correct it.
Some background on RietVeld Project : This project is started in May 2008. So data is available for 8-9 months. It is hosted on Google code and written in Python. The analysis is based on data upto 25 Jan 2009 (i.e. upto revision 392)
Author Network Graphs:
First lets look at the Author Network Graphs. The assumptions are
- Author and files are treated as nodes
- When author edits/adds a file a link/edge is created between the author and file
- Number of edits (commits) are treated as 'weight' of the link
- I have removed the edges with weight 1 to reduce the chances of errors.

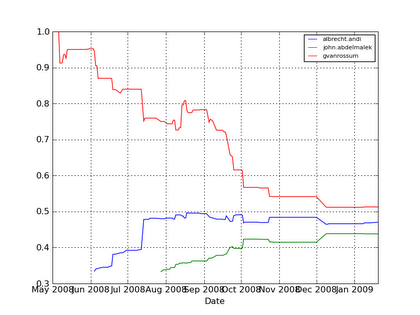
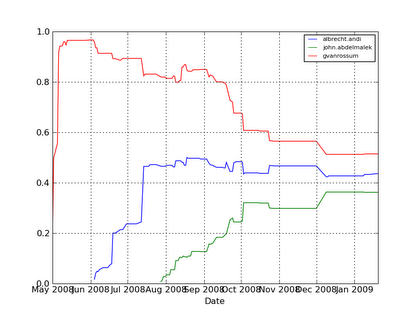 Closeness Centrality